


Types of Charts in MS-Excel
What are the various types of charts available in MS-Excel?
A chart is a medium that is used to graphically present the worksheet data in MS excel.
-
They provide a more accurate analysis of information
-
They make it easy to see comparisons, patterns in the data
-
In MS-Excel you can easily create a chart of your choice and also add title and more.
Types of Charts:-
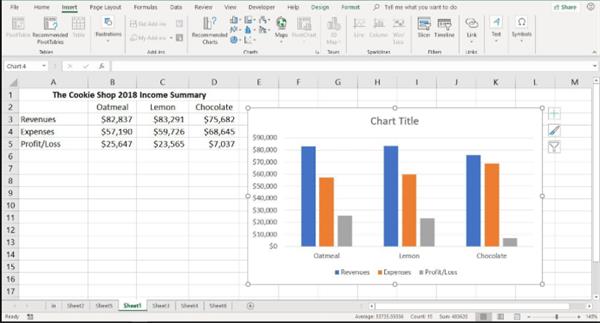
1) Column chart: -They are the most common types of charts used to display data. These are most often used to show amounts or the number of times a value occurs. The amount is displayed using a vertical bar or rectangle.
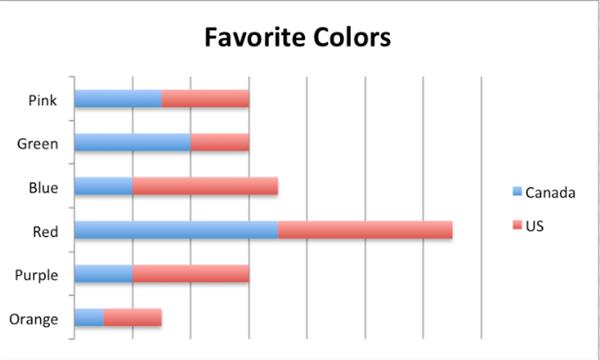
2) Bar chart:- A bar chart is a chart that shows information about two or more discrete objects, events, locations or groups of people, etc.
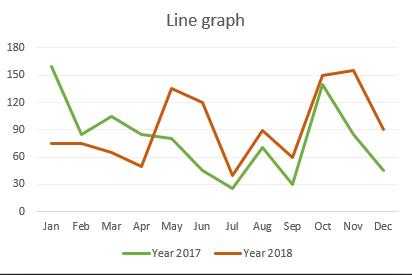
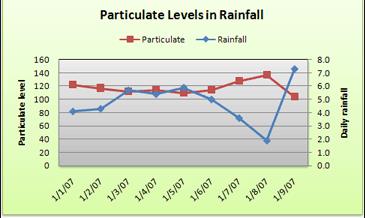
3) Line chart:- It shows continuous change over the line.
For example- A line graph can be used to observe the changes in temperature in the month of December the line will go up and down as the data varies by analyzing the line graph, one can get a better idea of the changes that took place as time went on.
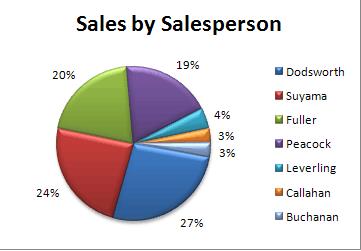
4) Pie chart:- It is a circular graph where the pieces of the pie are used to represent a percent (%)of a whole. These charts denote use horizontal and vertical axes to plot charts. The circle of the pie represents 100%, The size of each slice show which part of 100% it represents.
5) XV (Scatter chart): -An XY chart also called a coordinate graph or scatter plot is a chart that shows different ordered pairs on an XY axis. It shows uneven internals or cluster of data. Commonly used for scientific data.
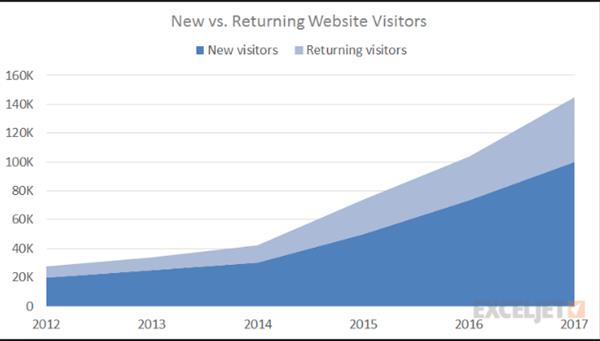
6) Area chart:- It emphasizes the magnitude of change over time by displaying the sum of plotted values, an area chart shows the relationship of parts to a whole. It combines some of the characteristics of a line chart with a bar chart.
7) Radar chart:- Displays change in values relative to a centre point. Radar with the area covered by a data series filled with colour is called filled Radar.