


How to debug an Angular Application in Google Chrome
Create a basic application or open any existing angular app in visual studio code. I have created a basic application and opened the same project in the VS code.
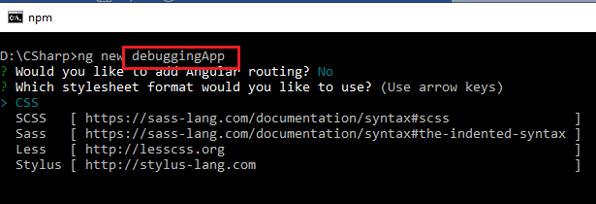
I changed the default app.component.html with the following code, this will create a UI with two textboxes just for an example to add (sum) two values with doSum() function in App.component.ts so that I can put a breakpoint to test the debugging.
App.Component.html
<div>
  <h1>Basic App for testing debugging in chrome</h1>
  <p>Value 1 <input type="number" placeholder="Enter Value 1" [(ngModel)]="val1"></p>
  <p>Value 1 <input type="number" placeholder="Enter Value 2" [(ngModel)]="val2"></p>
  <p><input type="button" value="Sum" (click)="doSum()"></p>
  <p>Total: {{total}}</p>
</div>
App.component.ts
export class AppComponent {
  title = 'debuggingApp';
  val1:number;
  val2:number;
  total:number;
  public doSum()
  {
    this.total=this.val1+this.val2;
  }
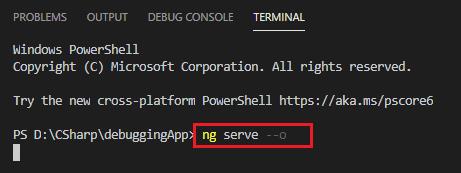
After Editing your default code of the App component, Serve your app with following Angular CLI command.
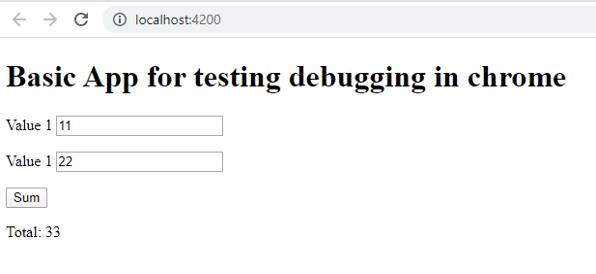
This will be your output after changes.
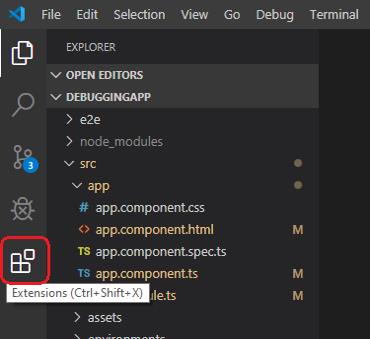
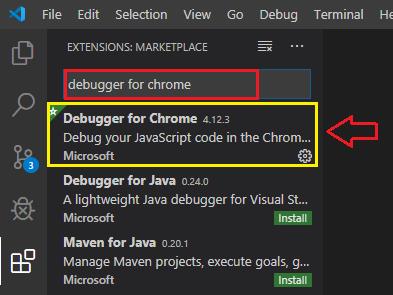
Now we need a google chrome debugger extension for visual studio code, So click on extension option at left side icons of VS code.
Write “debugger for chrome” in the search box and I hope you’ll get the same list as the following image select first one and click on the install option in the details page at the right side.
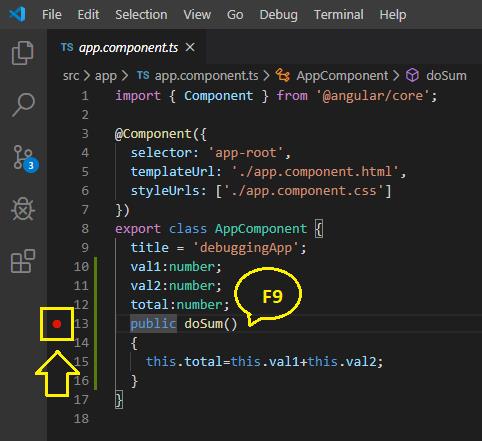
Now Go to the line that you want to debug when this will be executed, Now click at most left of this line or press F9 to add a breakpoint in this line.
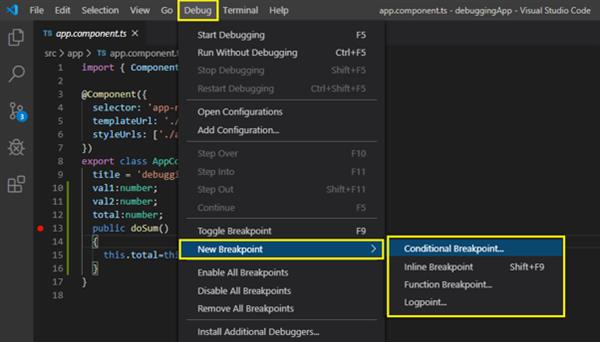
Or you can find the debug option from the top menu of the VS code and select the debugging breakpoint options that suit your requirement.
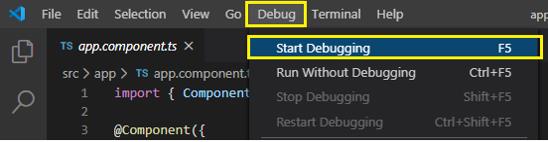
Now Press F5 or Start Debugging option from debug menu
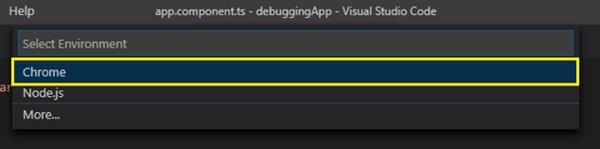
First time for debugging we have to select the debugging environment for visual studio code debugging setting, Select Chrome.
Once you’ll set your debugging environment it’ll set in launch.json, this file is just for local not for production.
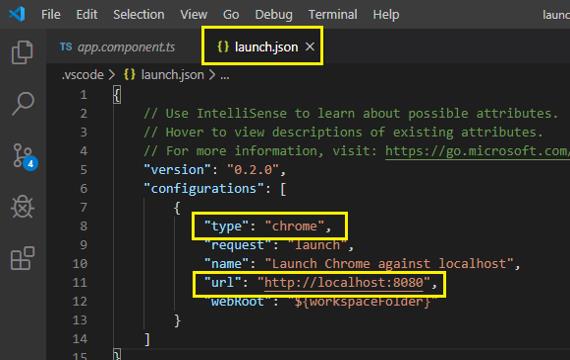
Now, Change your port number in the URL option, Where your application is working Like the default port number is 4200.
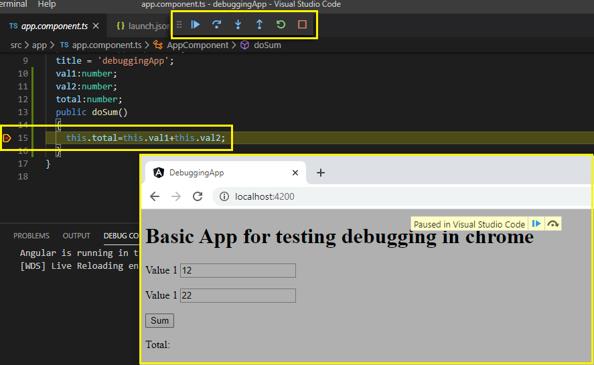
Now press F5 one more time and you’ll see this will launch new chrome with the same URL that you set in launch.json. Enter the values and click to the button, see this will automatically enable that breakpoint in App.component.ts.
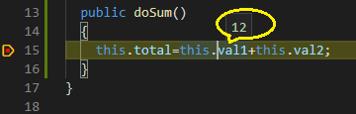
You check your inputs at the code.
Press continue in debug tool to submit this statement or next breakpoint.
Thanks, I hope this will help you.