CHART FORMATTING
We can format the chart as we want to.
A chart consists of two areas namely Plot area and Chart area. The inner part of the chart is the Plot area, one can just click it to see it.
The outer part is the Chart area. We can format all these things by right clicking on chart and select Format chart area. (as displayed in this picture, to extreme right)
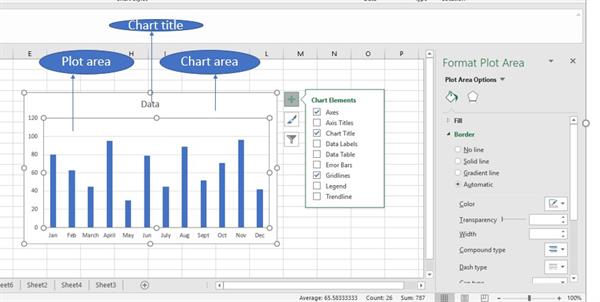
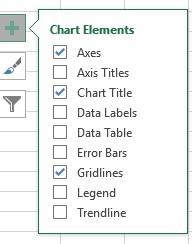
The symbol contains many options. The options that are ticked are displayed on the chart. One can enable and disable them according to will.
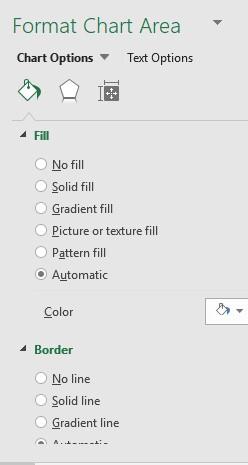
Format Chart Area has many functionalities.
We have two areas-
Chart Options
- Fill & line
It can be used to change the color of chart or bars.
When you click on bars, they will be selected and then you can change its color through fill option.
- Effects
- Size & properties
Text Options
- Text Fill & Outline
- Text Effects
- Textbox
Example 1
- Another feature of charts is that we can switch rows to columns and vice-versa.
This can be achieved by clicking on the chart. As soon as you will click on the chart you will see Design and Format Tab.
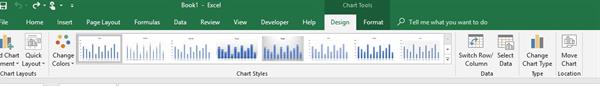
Here you can see, Switch Row/column option under Data tab.
Select it and the work is done.
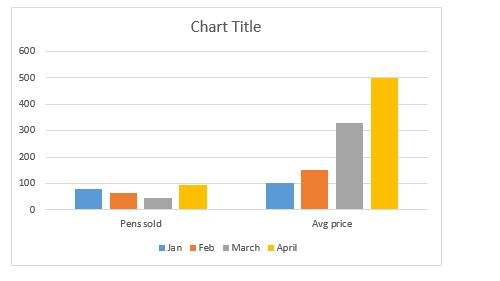
EXAMPLE
Suppose we have this table.
|
Years |
Pens sold |
Avg price |
|
Jan |
80 |
100 |
|
Feb |
63 |
150 |
|
March |
45 |
330 |
|
April |
95 |
500 |
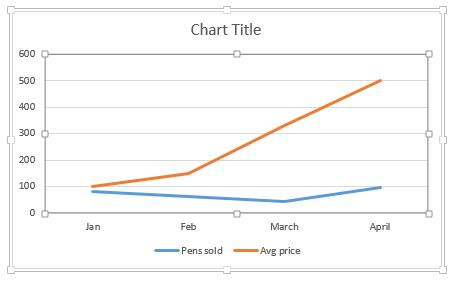
Chart for the above table:
When we change the rows to columns.

Note- You will not see design tab until you click on the chart.
- One can change the chart type directly using Change Chart Type option in Type Tab, next to Data Tab.
We can change any chart to any type. Suppose I have changed it to Line chart.
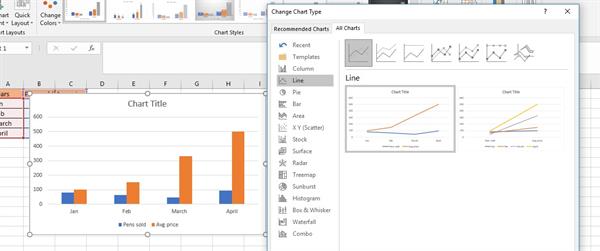
OUTPUT